Year in Review - My Energy Usage

Happy new year!

Here is a little Year in Review™ of my gas and electricity usage for 2022 for anyone that’s interested.

In short, our household used 9% less energy, but it cost us 54% more. So let’s explore why :slight_smile:

First some context, I live in a 1960s, 3 bed, 80sqm, semi-detached home with my partner and our cat. We have owned a Renault Zoe (electric car) since March 2020 and driven 12k miles total and have 2.1kW of south facing solar panels on our roof (installed Feb 2019). We have gas heating and an electric hob and oven.


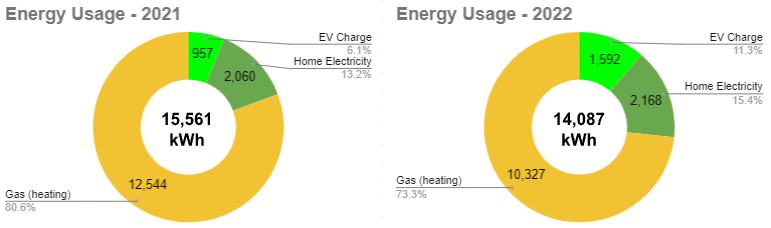
In 2022, we used 9% less energy (1.5MWh) overall compared with the previous year (14MWh in 2022 versus 15.5MWh in 2021). Our gas usage (yellow) dropped by 18%, our EV charging (light green) increased by 66% and our regular home electricity usage rose by 5%.


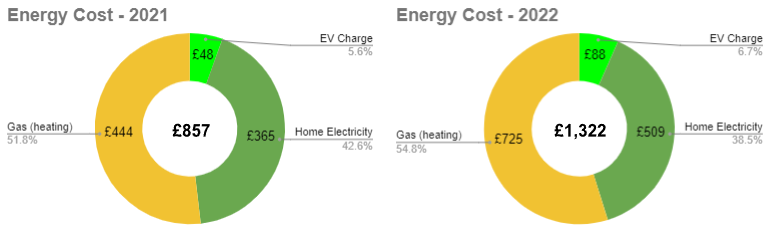
Unit prices rose significantly in 2022 (more on that in a sec). This meant that our total utility cost rose from £857 in 2021 to £1,322 in 2022, a 54% rise.


Here we see our total utility cost per month with 2022 highlighted in orange. Our gas unit price pretty much doubled in April 2022, then went up again in October to nearly 3x the original rate. The true impact of this price rise was not felt until we started using the heating in late October 2022.

In addition, our electricity unit price also increased significantly in October 2022. The day rate rose from an incredibly cheap (in hindsight) 14p/kWh to 40p/kWh. The chart above shows how our unit prices changed during 2022 while on Octopus Go tariff.


Here we see our electricity usage split by home (dark green) and EV charging (light green), and the cost (grey) per year. The increase in our electricity usage is because we charged our car more frequently. Thankfully we’re able to charge on the overnight rate so the impact on electricity cost wasn’t too insane (+44% year on year). We haven’t returned to the home electricity usage we would get pre-pandemic yet (approx.1.5MHw per year) because we still work from home on occasion.

On the topic of my electric car, I drove it 6k miles this year. I used 1,592kWh to charge it, costing a total of £88. This means I averaged 3.75 miles per kWh in 2022 and each mile cost 1.4p. This aligns with some of my earlier calculations here and over here and here too. The EV continues to work out around 10 times cheaper to run than a diesel equivalent per mile I think.


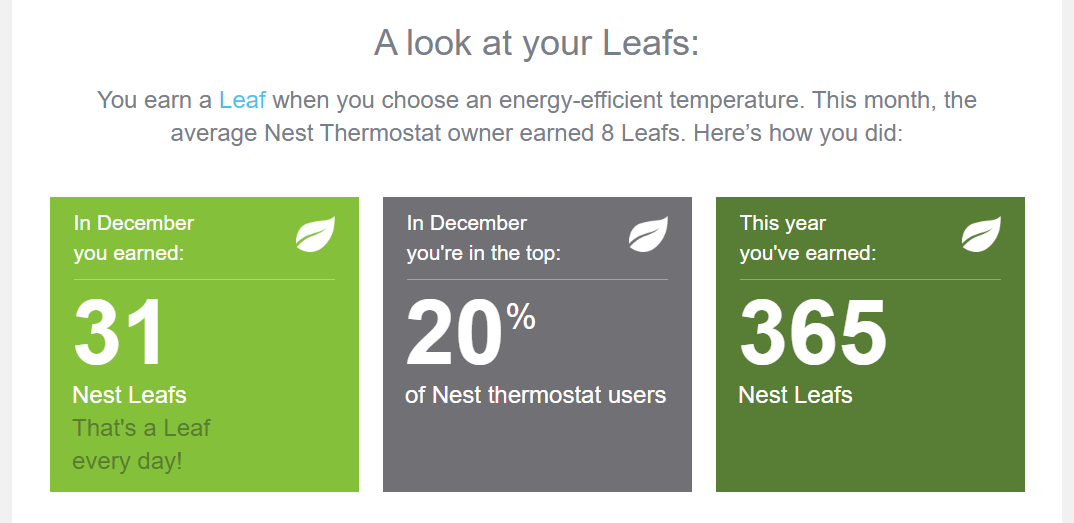
As mentioned, we managed to reduce our gas usage by 18% this year. This was mostly achieved by adjusting our Nest thermostat schedule to reduce the peak temperature from 19°C to 17.5°C. It also probably helped that the UK had the warmest year on record with the average UK temperature this year up by around 1°C. That said, it wasn’t enough to keep the cost from going up 63% due to the significant rise in unit gas price in October.


We had a solar system installed in Feb 2019 and it continues to out perform the installer’s estimates for monthly generation. This year, it generated a total of 2,409kWh. We only have a generation meter at the moment, so I can’t tell how much of that electricity we used locally versus exported to the grid.


So overall, a mildly interesting year; a sharp rise in unit prices, lower gas usage, increased electric car charging and our solar continues to perform pretty well. We’ve just started to feel the impact of the rising gas unit price this winter, so I expect next year’s energy bills to far exceed previous years by at least a factor of 2.

Main goal for 2023 is to try to find an installer for a home battery (probably the myenergi Libbi if I can get my hands on one). Once we have the battery storage, next step will be heat pump.


I have a lot more data and graphs, so feel free to ask any questions if you’re curious or if anything is unclear. I’d also be interested to hear how these figures might compare to yours.

19 Likes

I love this! You’ll be pleased to know you’re still my graph/data hero in 2023.

We’ve only lived here since May so this is the first winter and I’m still trying to adjust to get the right routine and temps. Heating came on this morning but was off again by 8am, yet I feel like I’m too warm in a hoody so I think it needs to go down.

Scandalous how much it’s changed for 2022 in your graph. Nearly £300 for Dec when 3 of the other 4 years are under £100.

4 Likes

Feels like this deserves to be a post on a personal blog. Great stuff!

2 Likes

Cheers all, I’ve done a little more exploring and will post the results shortly. Let me know if there’s anything in particular you’re interested in

1 Like

This is great. What are you using to track everything?

I pull everything together in Google sheets.

  • “Octopus watch” app lets you download half hourly electricity usage as a CSV
  • I manually add my daily gas usage from my smart monitor, I do this about once a week
  • I take photos of my dash using my phone everytime I charge my car to give me an idea of when and how much I charge, and add this information to my spreadsheets every few months
  • my solar inverter has a web interface that lets me download raw 5 min data

I do a bunch of enhancement of all this CSV data by adding additional columns for things like year, month, week number, day of week, etc. Then I use pivot cables on this augmented/enhanced data to get the data into the formats necessary for the charts that I want to produce.

Coincidentally, it’s the same spreadsheet that I use for all of my other metrics including finance (including Monzo and mortgage), health (including steps, weight, hours sleep, etc). I keep everything together, those a lot of the raw CSV data is kept elsewhere and I use the IMPORTRANGE formula to keep things running smoothly.

5 Likes

Love it.

Intelligence via data. It’s massively underrated.

Here’s a screenshot of my HA dashboard (taken from a laptop display, but actually controlled via a repurposed Nexus 7 tablet strapped to the kitchen wall) - I spent most of December rebuilding the HA server to update the current basic devices and integrations.

The level of automation given and data history (and energy manipulation) is simply mind-blowing. Here’s the Nest Thermo data from the last 5 days:

Getting slightly warmer…

Next up, washing machine, upstairs lights, TV’s, Google Home’s, external cameras and a very specific hot-tub project to be added, along with Grafana graphical data for the whole shebang…

5 Likes

Wow. 2022 was a year the Nest thermo really worked for us. 365 Nest Leafs!

3 Likes

Little first quarter update on my energy use:


Gas

Gas usage is down a little on the same months last year, but costs are up more than double.

I’m aiming to keep gas usage down for the whole year, but at its current trajectory I suspect gas cost will end up close to 3x last years costs.


Electricity

Electricity usage for far this year is on par with last year, while costs are up more than double due to renewing the octopus go rates (from 5p-14p, to 7.5p-40p).


Combined utility costs

3 months of total utility spend (combined gas and electricity) has already cost £700 this year. It took until September to reach that cost last year.

8 Likes

and

illustrate nicely the hideous price rises we’ve had :face_with_peeking_eye:

3 Likes

Yep, it’s scary. I’m now getting quotes for home battery storage because the potential savings are pretty significant. I suspect I can save at least £1k per year by load shifting and increasing reliance on electricity over gas for heating.

2 Likes

It’s honestly not a bad idea

I don’t have the heat on at home unless I really need it, I sit in an electric blanket, nice and cosy

2 Likes

dipping my toes into the world of home assistant…

Already hit a bunch of road blocks that are causing major headaches, but its early days. Nest in particular is being a real pain and I think its because of how my Nest account was migrated to/with my google home account.

2 Likes

It’s a bit of a learning process, especially for those ‘fringe’ devices which aren’t officially supported by HA, but do have solutions via HACS (Home Assistant Community Store). My install seems stable after a lot of work I did with it back in December which is good, although a fair amount involved customised YAML config files which at first is daunting but you learn real fast.

FWIW, I hit problems with Nest and account migrations a couple of years ago which I sorted out back then, so since running HA, it has ‘just worked’ - thankfully.

Good luck!

I’ve just been notified that an OHM (Octopus Home Mini) is finally on its way to me, which is great because the Octopus HA integration supports the OHM, so real-time energy use reporting via HA. Looking forward to that.

Oh, the automation fun I’m having with this lot. The familyW think I’m a nutter.

2 Likes

With a bit of brute force I just managed to get the nest thermostat to work.
I needed to delete the thermostat from the nest app, then add a new “home” in the nest app, which automatically pulled my ‘Home’ from the google home app. Then when I readded the thermostat to the nest app it correctly recognised the google home ‘home’ and then all the complicated set up stuff that hadn’t worked previously started working.

Haven’t quite figured out everything I want this to do yet. But I think I’m going to lean into the idea of a visual schematic of the home with interactive buttons throughout. Especially since I happened to have already sketched out my home layout ages ago:

I’m currently only running it on a raspberry pi 3 and that’s presenting more road blocks as I don’t think its capable of running the visual studio code stuff that’s necessary to get the HACs community add-ons to run.

3 Likes

I now have HA running on a RPi4. The RPi3 which it used to ‘run’ on was repurposed to be the Plex server. And that’s had a fair amount of issues too. The RPi3 is the only common factor in the issues I’ve experienced, so based on that alone, I’d recommend RPi4’s for these applications.

I’ve not delved into 2D/3D renders of the house with HA-linked kit highlighted, but your images do look nice :+1: That’d make a cool-looking control dashboard. I may have a look into it!

1 Like

It’s using the “picture elements” card. Figured out the basics which just involves loading a PNG from a URL, then setting the X and y position of the buttons and deciding the devices that they control. Next step for me will probably be to update the png to allow proper space and labels for the devices. Then I’ll see if I can get the picture elements card to basically be the whole dashboard, with some device icons that link to other pages with detailed breakdowns.

Think I’ll try to get a raspberry 4 before I sink too much time into setting things up on the raspberry 3.

2 Likes

Mine showed up today! A breeze to set up and already showing data in-app. I can see this being addictive! :smiley:

4 Likes

Awe! I want mine. I’ve been waiting ages, haha. Hope it’s useful, a lot of people struggle to get them going.

I think these people that struggle with them have their meters on external walls and stuff, where the Zigbee signal doesn’t reach

1 Like

Yeah I was waiting for months, possibly a year! I signed up to the trial but didn’t get in.

My meter is outside in the wall, IHD and OHM is on the opposite side of the house. No issues so far! :zap:

3 Likes