365 Days with Monzo - Add your Data

Because I’m a nerd, I’ve made something to review how your last the 365 days between 1st Jan and 31st have been for you. This is definitely not YearInMonzo. It’s very different.

Link

File > Make a Copy – Save it where you wish

You’ll need to get your data. You can either download the CSV and paste this in, or you can use the Google Sheets feed if you subscribe to Plus/Premium. I will not see any of your data. It doesn’t have to be just 2021 data, the formulas will sort that out.

In the Data Input tab, in between the first " ", add your URL or copy and paste the old school way.

The next tab is “Merchant Replacements” if you want to tidy your data up a bit, you can do this here.

Image 2

There is some data that I can’t get, contactless vs card, in person vs online etc. But this is what I’ve come up with… (I’ve edited out some of my data)

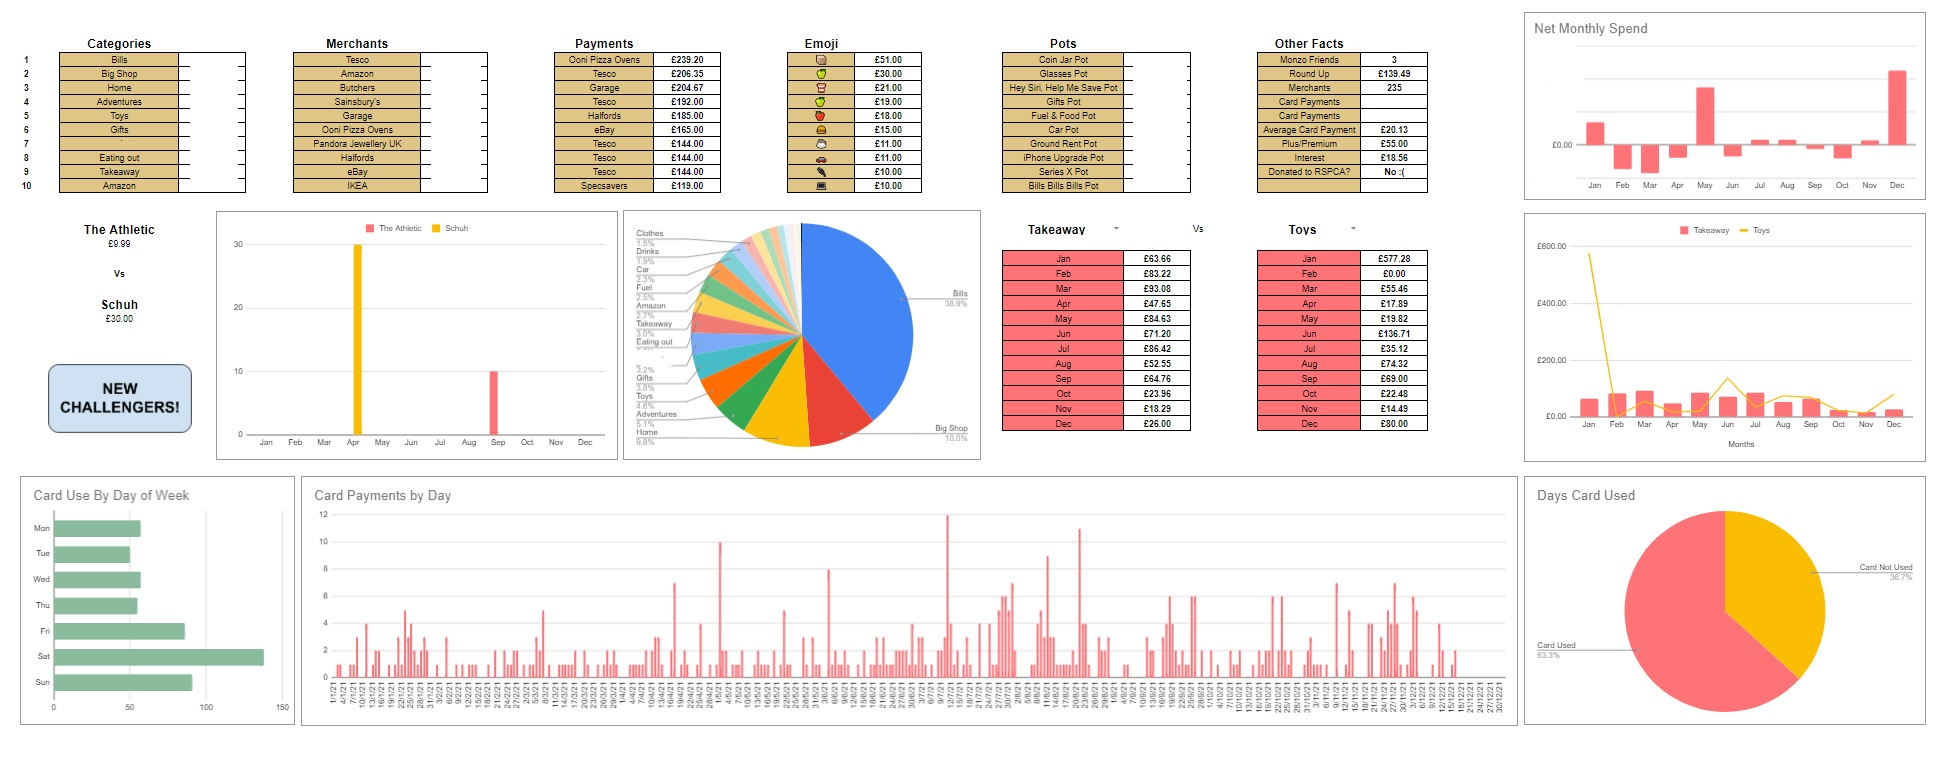
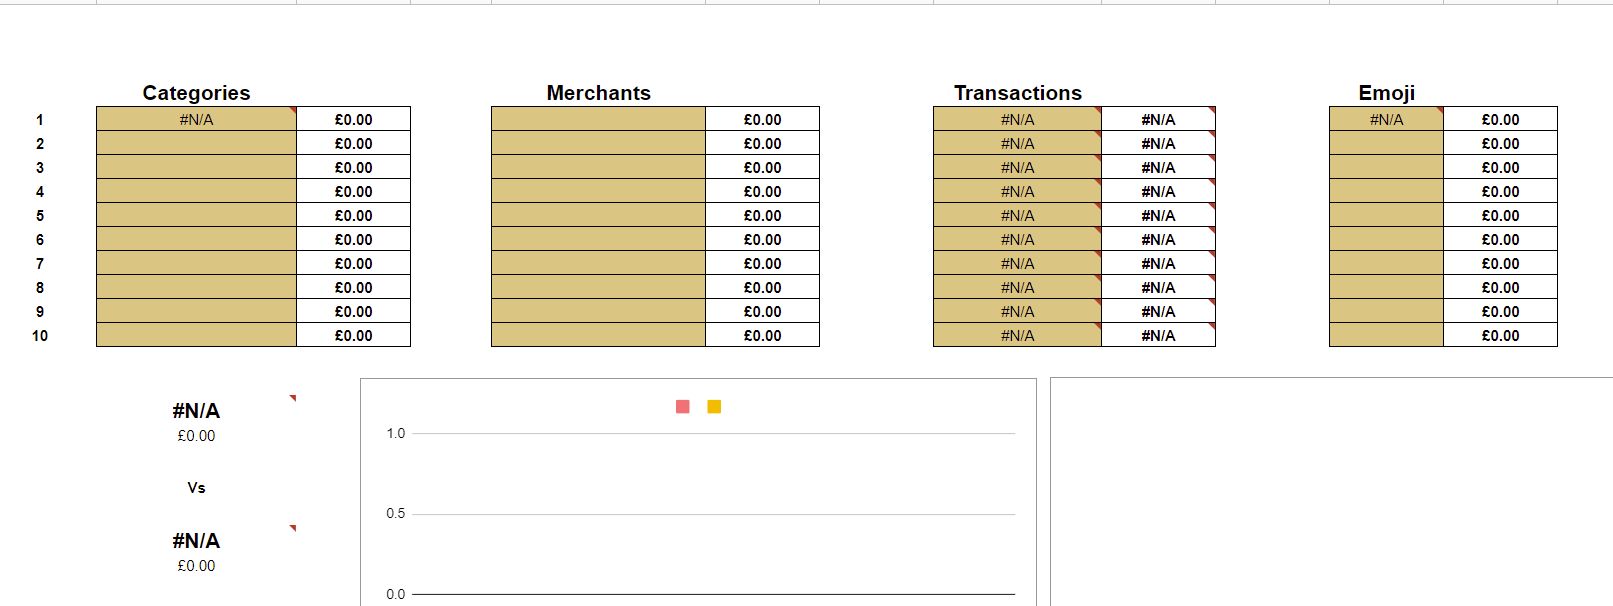
Across the top are your top 10s. Categories, merchants, transactions and emoji. How much you’ve spent in all these areas in 2021. Then your top 10 pots. Some other very important facts.

Graphs on the right show your monthly net, above the line shows you spent more than you saved. Ooops.

The coral tables are your categories, you can use the selection box and choose any of your two categories and compare them.

The pie chart of all your categories is mainly so that I can see what a mess it looks like for @Alexxxxx

At the bottom is card use. Which days did you spend on your card the most? Are you a Saturday spender and resting on Sunday? How many times you used your card on each day of 2021 and then a split of days used vs not used.

Then the best part!

Put two merchants against each other. Press the “New Challengers” button and it will generate at random two new merchants to compete against each other.

(I’m not 100% sure the macro will work for everyone else, so if it doesn’t, you can just press backspace/delete in any empty cell and that will refresh it)

There will be a prize for the best two merchants against each that are in no way related but the graph shows differently.

34 Likes

Fantastic s/sheet. I’m afraid that comprehension and implementation though is way above my pay grade. Impressive though. R-

2 Likes

Bravo! (Again)

2 Likes

Wow. Me and my lovely categories will get on this asap… :ok_hand:

Edit: okay… so something isn’t working for me. It looks like the below and I’m getting the following message if I hover over any of the cells showing N/A.
------- Error No matches are found in FILTER evaluation.

All my data is showing up fine in the data input sheet from columns A to P.

And the card payments by day bar chart and the days card used pie chart have populated. Card use by day of week has not though.

This is great @Revels :tada:

Thoroughly impressed.

4 Likes

Hmm, that’s strange. I’ve just put my data back in and all appears fine.

In the data tab, the yellow columns, do they stretch down as far as your data does?

1 Like

They did not! Were about 6,000 rows short…

All seems to be working now, thanks!

Here is my categories pie chart :grimacing: not sure I’m entirely happy with my priorities depending on the extent to which the top few categories are properly reflective of repayments/splits (which are sometimes via other bank accounts).

image

1 Like

This is really really good. Nice work!

3 Likes

You look to be well insured at least :smiley:

3 Likes

Hahaha I know… not sure how I feel about that one in particular. We got home for the first time this year, and an annual travel insurance for both partner and I just the other day. So I think it’s okay… but that chart has certainly made me think about assessing a little bit more…

2 Likes

This looks excellent! Going to give this a go tonight.

A little part of me takes this as a challenge to make my own too

4 Likes

How do you export only this year on the Monzo app? :thinking:

Account > Feed > Statement History > Custom Date Range > Pick the dates > Export as CSV

1 Like

This is fantastic. Will test with a Joint account to ensure parity.

2 Likes

This should be ‘Account > Manage > Statement History > Custom Date Range > Pick the dates > Export as CSV’ ?

Other than that, it works perfectly with a Joint Account. Parity Party :partying_face: :tada:

2 Likes

This looks great, trying it out now. Why doesn’t the data import include columns Q and R (‘Money Out’ and ‘Money In’)?

Did you make anything in the end?

Great sheet! Although I wish I hadn’t seen some of those numbers, take it back :rofl:

1 Like

In the Data Input tab, in between the first " ", add your URL or copy and paste the old school way.

What URL are you referring to? The Google sheets link URL?

Thanks

This topic was automatically closed 180 days after the last reply. New replies are no longer allowed.